
Topic: Climate Alterd By Natural Events And Human Influences
Climate Alterd By Natural Events And Human Influences
The Marcellus Shale
The Marcellus shale is a black shale formation that was formed during the Middle Devonian Period. The shale extends from New York State as far south as Alabama. The Marcellus shale is exposed at the surface in the northern Finger Lakes region, and is buried 2.1 kilometers below the surface along the New York-Pennsylvania border.
Geologists estimate that the Marcellus shale contains hundreds of trillions of cubic feet of natural gas. Most of the Marcellus shale does not allow fluids (gases and liquids) to flow through the rock. In order to obtain the natural gas trapped in the rock, the shale is fractured. This hydraulic fracturing consists of drilling a well, then pumping in large amounts of water containing chemicals and sand under high pressure to create cracks in the gas-bearing rock. Although this process can allow the trapped gas to be removed from the shale, opponents of hydraulic fracturing argue that the chemicals used in the process may lead to groundwater contamination.
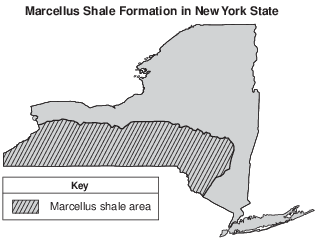
Why might people living near Elmira, New York, be opposed to energy companies using the hydraulic fracturing process?
(1) It could lower their energy costs.
(2) The injected water could cause flooding in the area.
(3) There is the potential for the pollution of groundwater.
(4) There is an increased risk of volcanic activity.
El Niño is a condition associated with a buildup of unusually warm water along the western coast of South America. Which changes in air temperature and precipitation usually occur in that region during El Niño?
(1) lower air temperature and less precipitation
(2) lower air temperature and more precipitation
(3) higher air temperature and less precipitation
(4) higher air temperature and more precipitation

Two major greenhouse gases that absorb outgoing long-wave radiation within the atmosphere are
(1) methane and oxygen
(2) methane and carbon dioxide
(3) nitrogen and oxygen
(4) nitrogen and carbon dioxide
The graph below shows changes in carbon dioxide concentrations in Earth’s atmosphere over a 140-year period. Carbon dioxide concentrations are shown in parts per million (ppm).

This significant change in CO2 concentration is most likely caused by
(1) decreased cloud cover, and is predicted to decrease average global temperatures
(2) decreased volcanic activity, and is predicted to increase average global temperatures
(3) increased use of fossil fuels, and is predicted to increase average global temperatures
(4) increased El Niño activity, and is predicted to decrease average global temperatures
During an El Niño event, the South Equatorial Current reverses direction and flows over the top of northern portions of the Peru Current, causing
(1) warmer surface ocean waters along the northeast coast of South America
(2) warmer surface ocean waters along the northwest coast of South America
(3) cooler surface ocean waters along the northeast coast of South America
(4) cooler surface ocean waters along the northwest coast of South America

The inferred position of the future coastline is based on the assumption that the
(1) total amount of global precipitation will decrease
(2) thickness of the ozone layer will decrease
(3) concentration of carbon dioxide in Earth’s atmosphere will increase
(4) rate of uplift of the North American continent will increase
El Niño
Under normal Pacific Ocean conditions, strong winds blow from east to west along the equator. Surface ocean water piles up on the western part of the Pacific due to these winds. This allows deeper, colder ocean water on the eastern rim of the Pacific to be pulled up (upwelling) to replace the warmer surface water that was pushed westward.
During an El Niño event, these westward-blowing winds get weaker. As a result, warmer water does not get pushed westward as much, and colder water in the east is not pulled toward the surface. This creates warmer surface ocean water temperatures in the east, allowing the thunderstorms that normally occur at the equator in the western Pacific to move eastward. A strong El Niño is often associated with wet winters along the northwestern coast of South America and in the southeastern United States, and drier weather patterns in Southeast Asia (Indonesia) and Australia. The northeastern United States usually has warmer and drier winters in an El Niño year.

Compared to non-El Niño years, which climatic conditions exist near the equator on the western and eastern sides of the Pacific Ocean during an El Niño event?
(1) The western Pacific is drier and the eastern Pacific is wetter.
(2) The western Pacific is wetter and the eastern Pacific is drier.
(3) The western and the eastern Pacific are both wetter.
(4) The western and the eastern Pacific are both drier.
Most scientists infer that increasing levels of carbon dioxide in Earth’s atmosphere are contributing to
(1) decreased thickness of the troposphere
(2) depletion of ozone
(3) increased absorption of ultraviolet radiation
(4) increased global temperatures
Which natural event periodically weakens western surface ocean currents in the equatorial Pacific Ocean, resulting in a change in air temperature and precipitation patterns in the United States?
(1) El Nin˜ o
(2) transpiration
(3) ocean tides
(4) volcanic eruptions
Which event is inferred by most scientists to be responsible for a climate change that has recently led to a decrease in the size of most glaciers?
(1) a decrease in the rate of divergence of lithospheric plates along a mid-ocean ridge
(2) a decrease in the amount of insolation reaching Earth’s surface
(3) an increase in the amount of greenhouse gases in Earth’s atmosphere
(4) an increase in the amount of vegetative cover in the tropics
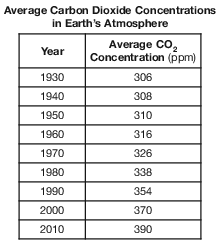
On the grid in the image below, construct a line graph by plotting the average carbon dioxide concentrations in Earth’s atmosphere for each year shown on the data table. Connect the plots with a line. [1]

Allow 1 credit if all nine plots are within the circles shown below and are connected with a line that passes within the circles.
• Note: It is recommended that an overlay of the same scale as the student answer booklet be used
• to ensure reliability in rating.
• 
Solar Heating
Solar collectors in solar heating systems harness the power of the Sun to provide thermal energy for heating hot water and house interiors. There are several types of solar heating systems. The best system will depend on the geographic location and the intensity of the Sun. A solar heating system saves energy, reduces utility costs, and produces clean energy. The efficiency and reliability of solar heating systems have increased dramatically in recent years.
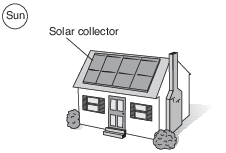
State one advantage of using solar energy instead of burning fossil fuels to produce thermal energy for your home. [1]
Allow 1 credit. Acceptable responses include, but are not limited to:
• — saves energy
• — reduce utility costs
• — produces clean energy
• — A renewable source of energy has less effect on the environment.
• — less pollution/CO2 emissions/reduced carbon footprint/less global warming
• — conservation of fossil fuels
• — Solar energy is renewable.
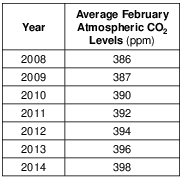
On the grid in the image provided, construct a line graph by plotting the data for the average February atmospheric carbon dioxide (CO2) levels for the years 2008 to 2014. Connect the plots with a line. [1]
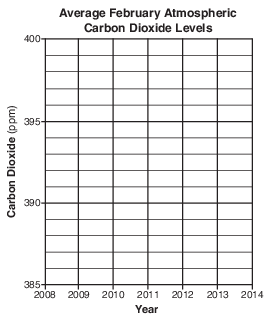
Allow 1 credit if all seven plots are within or touch the circles shown and are correctly connected with a line that passes within or touches each circle.
• Note: Allow credit if the line does not pass through the student plots, but is still within or touches
• the circles.
• It is recommended that an overlay of the same scale as the student answer sheet be used to ensure reliability in rating.
• 
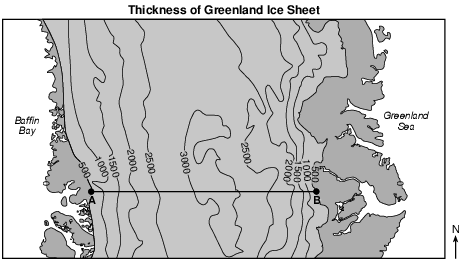
Greenland Ice Sheet
The Greenland Ice Sheet is a vast body of ice covering roughly 80 percent of the surface of Greenland. The ice sheet is almost 2400 kilometers long in a north-south direction. The ice sheet, consisting of layers of snow compressed over more than 100,000 years, contains a valuable record about Earth’s past climates. The ice sheet glaciers continue to flow seaward and deposit sediment, but global warming has affected them. Warmer air temperatures have caused increased melting, resulting in a thinning of the ice sheet and faster glacial movement at the ice sheet edges.
Identify two major greenhouse gases that are inferred to contribute to global warming and increased temperatures in Greenland. [1]
and _________________________________________
Allow 1 credit if both gases are correct. Acceptable responses include, but are not limited to:
• — carbon dioxide or CO2
• — methane or CH4
• — water vapor or H2O(g)
• — ozone or O3
• — nitrous oxide or N2O
• — chlorofluorocarbons/CFCs
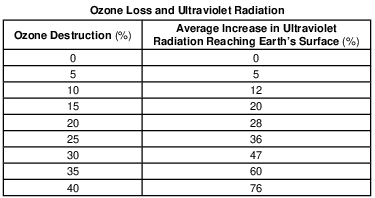
Ozone closer to Earth’s surface has been identified as a greenhouse gas. Identify two other gases in Earth’s atmosphere that are considered major greenhouse gases. [1]
__________________________________ and __________________________________
Allow 1 credit for two correct responses. Acceptable responses include, but are not limited to:
• — carbon dioxide/CO2
• — water vapor/H2O
• — methane/CH4
• — nitrous oxide/N2O
• — chlorofluorocarbons/CFC